Richest Cities in Kansas (2026)
by Kristen Carney
Updated: February 9, 2026
Richest City in Kansas
The richest city in Kansas is Mission Hills in Johnson County with an average household income of $466,584 as of 2024. While exceptionally affluent, Mission Hills only has a population of 3,548 as of 2024. The richest city in Kansas with at least 5,000 people is Leawood in Johnson County with an average household income of $256,460 as of 2024 and 33,809 people as of 2024 according to the most current Census data available (citation).
| Rank | City | County | Population | Average Income | Median Income |
|---|---|---|---|---|---|
| 1 | Mission Hills | Johnson | 3,548 | $466,584 | $250,001 |
| 2 | Mission Woods | Johnson | 184 | $339,929 | $163,750 |
| 3 | Lake Quivira | Johnson; Wyandotte | 940 | $262,756 | $177,917 |
| 4 | Eastborough | Sedgwick | 919 | $260,711 | $193,250 |
| 5 | Leawood | Johnson | 33,809 | $256,460 | $185,625 |
| 6 | Westwood Hills | Johnson | 469 | $250,417 | $190,625 |
| 7 | Fairway | Johnson | 4,159 | $239,474 | $152,574 |
| 8 | Bremen | Marshall | 192 | $208,511 | $250,001 |
| 9 | Olmitz | Barton | 113 | $183,807 | $76,250 |
| 10 | Willowbrook | Reno | 81 | $180,336 | $142,500 |
| 11 | Ellis | Ellis | 2,189 | $165,670 | $73,000 |
| 12 | Prairie Village | Johnson | 22,874 | $162,440 | $113,530 |
| 13 | Westwood | Johnson | 2,093 | $153,806 | $118,250 |
| 14 | Viola | Sedgwick | 190 | $152,259 | $188,094 |
| 15 | Gem | Thomas | 98 | $148,298 | -$1 |
| 16 | Andover | Butler | 15,965 | $141,473 | $104,787 |
| 17 | De Soto | Johnson; Leavenworth | 6,414 | $141,401 | $104,000 |
| 18 | Baileyville | Nemaha | 126 | $141,344 | -$1 |
| 19 | Overland Park | Johnson | 200,306 | $141,150 | $104,834 |
| 20 | The Highlands | Reno | 479 | $140,012 | $97,500 |
Median Income versus Average Income: Which Should You Use?
We usually suggest using median income data – either instead of or in addition to – average income data as a true indicator of wealth. If you haven’t thought about median versus average since your last standardized test, you aren’t alone. Here’s what they are:
- average is the sum of a set of numbers divided by the count of numbers in the set
- median is the middle number in the set of numbers
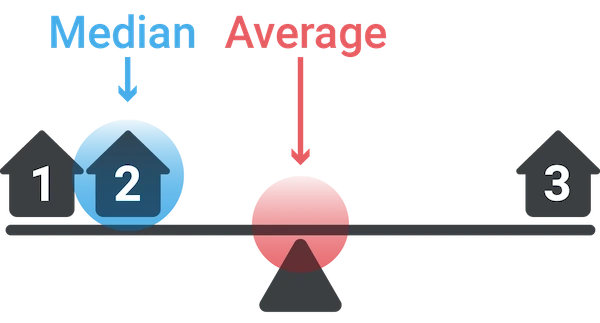
Now let’s say you had the following simplified set of income data.
Household 1: $30,000
Household 2: $50,000
Household 3: $1,000,000
The average income for this set is $360,000. The outlier data point ($1,000,000) skews the average WAY up. Conversely, the average income would be skewed WAY down if someone had an income of $500. The median income for the same data set is $50,000. Outlier data doesn’t skew the median.
Most Business Owners Should Use Median Income
So most business owners should use the median income as a true indicator of wealth, because it provides a more accurate representation of a typical income, especially in areas with significant income disparity.
When Should You Use Average Income
If your target market is high-income households, the average income may be more relevant. This is because the average income can highlight the presence of a higher concentration of wealthy individuals, which is beneficial for luxury goods and services marketing. We’re using average income on this page because using the Census’s highest reported median value of $250,001 could result in multiple ties for the richest geography.
Why do so many cities have a median value of $250,001?
The Census' American Community Survey uses $250,000+ as a jam value for median income estimates to protect privacy, ensure data consistency, and simplify reporting. A "jam value" in survey data refers to a placeholder or default value used when actual data points are unavailable, incomplete, or exceed certain thresholds. We represent this jam value as $250,001 to make it easy for you to sort.
You might also be interested in:
Email Me When New Data Are Released
Join thousands of subscribers and receive just 1 (ONE!) email a year in December when the US Census Bureau releases new income data for Kansas richest cities.
SOURCES
United States Census Bureau. Annual Estimates of the Resident Population: April 1, 2020 to July 1, 2023. U.S. Census Bureau, Population Division. Web. May 2024. http://www.census.gov/.
United States Census Bureau. B01001 SEX BY AGE, 2024 American Community Survey 5-Year Estimates. U.S. Census Bureau, American Community Survey Office. Web. 29 January 2026. http://www.census.gov/.
United States Census Bureau. B19013 Median Household Income, 2024 American Community Survey 5-Year Estimates. U.S. Census Bureau, American Community Survey Office. Web. 29 January 2026. http://www.census.gov/.
United States Census Bureau. "DP03 SELECTED ECONOMIC CHARACTERISTICS." 2024 American Community Survey 5-Year Estimates. U.S. Census Bureau, American Community Survey Office. Web. 29 January 2026. http://www.census.gov/.
Products & Services
Plumbing
Connect
- 1-800-939-2130
- Contact Us
© Copyright 2026 Cubit Planning, Inc.